And other WebGL hacks
Introduction
Anybody can save pictures from a website. The laziests just take a screen captures, more adventurous users open the browser's built-in page inspector. It'd be foolish nowadays to believe that you can prevent a user from saving your pictures. But what is lesser known is that the same goes for 3D objects.
Realtime 3D within the web browser (a.k.a. WebGL) has been around for long enough now to be widely supported and allow platforms to rely on it. Sketchfab is one of them, providing an amazing in-browser 3D viewer and being kind of the "YouTube of 3D objects", for what this means. Quite similar, though more oriented on self-hosting, is the Marmoset Viewer.
But another website that interested me a lot here is Google Maps. Did you now that you can hold the Ctrl key to rotate the view? Google Maps is actually in 3D on devices that support it. It shows not only the mounts and valley, but also a full 3D scan of every single building of many cities around the world!

Many cities around the globe are available in 3D in Google Maps
Wow, so much data! What cool things could we do with this? Nice 3D flight overs, impressive holliwoodian visual effects, city mashups… You tell, I'm sure you have a lot of ideas! But mmh, wait, how do we actually get this data into a 3D software?
This is where our long journey begins. I am not the first to try and tackle this challenge. Some people got crazy about it, and ended up doing photogrammetry from series of still screenshots of Google Maps. Yes, they 3D-scanned 3D-scanned data! As crazy as it sounds, this is actually the only "successful" reports I found.
Data tracking
There is a fundamental concept in information technologies that any good hacker keeps in mind: what data your computer sees, you can see it as well and save it. Hence, it is useful to always remain aware of what data a client's computer gets from a website.
To start with a simple example, we'll stick to regular images. Let's imagine that you want to display on your website a list of thumbnails of your creations or travel pictures. But you only have the full resolution versions of these files, and you feel a little lazy... no problem, HTML's <img/> tag, used for embedding images, does have a width parameter, so you can display the pictures smaller than they are.

Thumbnails of pictures
But what data does the client's computer receives in that case? It loads the full resolution pictures and then reduces them itself, for display only. This means that users may just right click and "Save image as" and they would get the full resolution image. On the other hand, if you scale down the pictures on the server side, the client will never access the full resolution image.
Now, what about 3D? What data does your computer get when you load a Sketchfab page? Well, what makes it possible to have such real time graphics is to get the client's GPU to render it. So this means that when displaying an object with WebGL, the raw data of the 3D model is accessible to your computer and, as a consequence, to you.
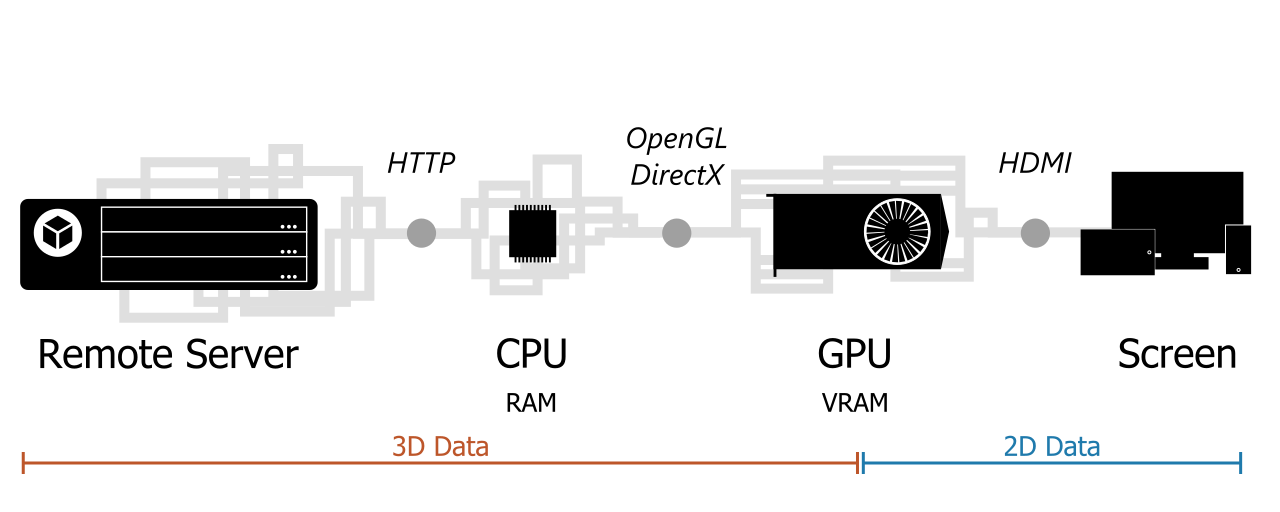
The data journey, from Sketchfab server to our screen, and its data bottlenecks
This sketch of the data journey shows that the data processed by the computer remains tridimensional up to the GPU. So at any point before that, we can theoretically access it. The sketch also highlights some data bottlenecks. These bottlenecks are steps through which all the data necessarily goes at some point, and so they are privileged entry points for our extraction exercise.
All of that being noticed, it is a bit trickier to get than a nice "Right Click, Save As". The core difference between a 2D picture and a 3D model is that when the computer hands on a 2D file, like a JPEG or a PNG, it knows exactly how to display it. But for a 3D model, there are so many different aspects to play with than each player has its own way of storing data. Its own private file format, if you will. If we want to interpret correctly the raw data, we must know how it is used by the player. In a way, the code of the viewer is part of the model.
There have been efforts to standardize this a bit, with the GLTF format, now in version 2. This is the format used to embed 3D objects in Facebook posts for instance (yes, you can do that). It is a great file format, that handles many usages of 3D models, but viewers playing with bleeding-edge rendering tricks will always need some extra options. If you are used to offline 3D models formats, you can see the GLTF as an interchange format, similar in usage to Alembic of FBX, but specific softwares will always need their own .ma/.mb, .max or .blend files.
Marmoset Viewer
Before heading to Google Maps, we will study a much easier case, namely Marmoset Viewer. Its source code is much lighter than others and more self-explanatory. This will help us to understand what data we are looking for and which challenges we will face, as well as introduce some useful tools.
Troughout this section, I'll be inspecting Marmoset Viewer's homepage. We will try to get the model of this nice fox:

Marmoset Vivfox Demo
Mesh data
So, what is a 3D model actually? There are theoretically many different ways to represent a 3D model, but when talking to the GPU, they must all boil down to two pieces of information:
- The point attributes, including at least the position in the 3D space of the mesh points, and potentially other information like color, texture coordinates, etc.
- The topology, which is the information about which point is connected to which other points. This defines faces and edges, and refer to the points by their index in the aforementioned point list.
So our goal is to find these two buffers of data, and export them in a format that a 3D software like Blender can handle.
Browser's Inspector
The web browser is an interesting environment. It must be very transparent, and allow for precise debugging, because website developers must ensure that everything works well, and troubleshoot efficiently when they run into problems. So all the major browsers feature a good page inspector, often accessed by pressing F12.

Network inspector in Firefox
Among the numerous tools provided, the first one that will help us is the Network Monitor. It displays all the network queries that the inspected website triggers and their responses. If the client's computer gets some data, it must be displayed here. And there is no way for website to cheat on this, since all queries fired from a web page are actually asked by the page and effectively performed by the browser, so the browser knows it all.
When loading Marmoset's home page, there are 162 queries emitted. How are we going to find which one contains the data we need? A very good hint is the file size. Another one is simply the file format. All the fonts, style sheets and images are not useful to us (we'll get to textures later on, and anyway Marmoset does not load them through regular image files). When sorting queries by descending size, one of them clearly stands out: vivfox.mview.

The heaviest query is an unkown mview file that is likely to contain 3D data
A file of 4.38 Mo, for this cute 3K triangles textured fox with 7 animation clips, it makes sense. And it is the only file with a weird extension. This must be our data. Yet we need to understand it, because for now it just looks like a large binary file. To this extent, we'll have a look at the marmoset.js script, the 3D viewer's code. Since the copyright notice allows it, I shared the file in a gist.
Marmoset source code
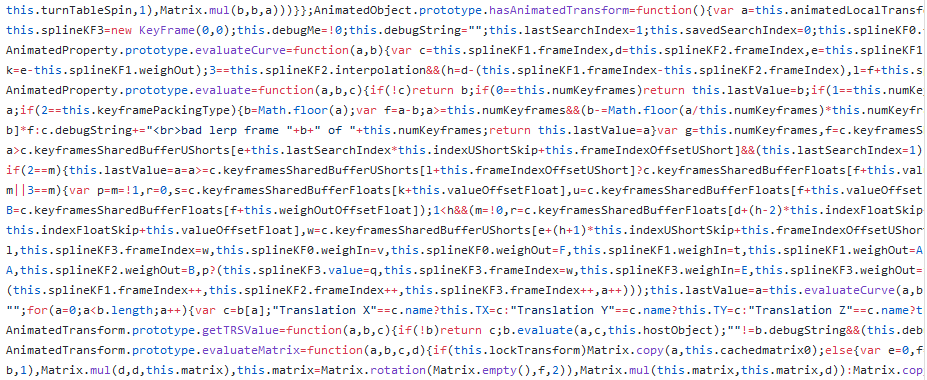
This looks horrible, but just because all useless blank spaces have been removed for a more compact file. The good news is that it has not been completely obfuscated, so function names still make sense, although some variables have been replaced with only a, b, c, d, etc. This will help us understand what we need. And fortunately, since this is very common with JavaScript sources, the browser's inspector provides a code prettifier, in the Debugger tab:
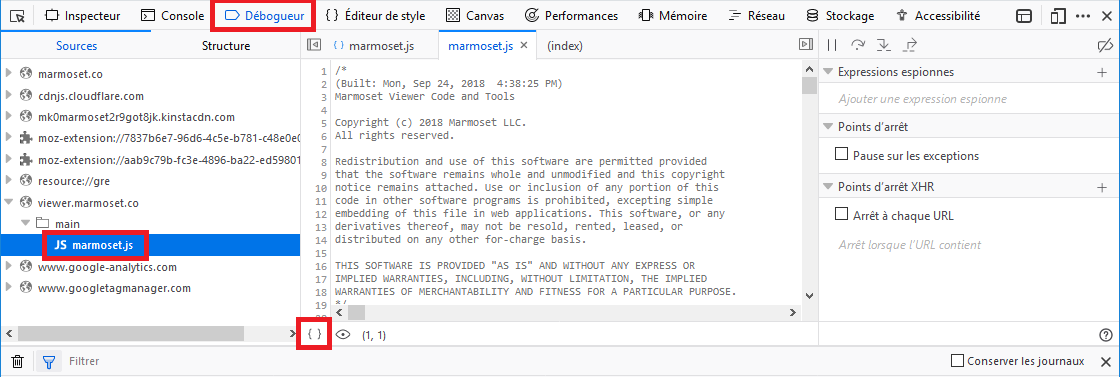
Source prettifier, to transform the code into a more readable version
The best to do after running the prettifier is to copy paste the code in a more comfortable text editor of your choice, because the source is more than 6k lines long.
NB: I cannot share with you the pretty version of the code, as it would violate its copyright notice, but I invite you to reproduce these steps because I will refer to the line numbers of the pretty version.
Reading viewer's code
If you have some time ahead of you, I recommend you to read this code. It is clear enough and implements many features of a modern physically based 3D viewer. You can check out the shaders at the very end. But you certainly don't have such time. So let's jump to the essential. We need to find where the data is interpreted into 3D vertex attributes.
Our best entry point is to look for network queries. The mview data file is loaded by the viewer, so there must be somewhere a call to the JavaScript function that does that: XMLHttpRequest. Since the marmoset viewer is a standalone script, it does not hide this in any complex third party library, so we can use the search function of our text editor.
There are 8 uses of XMLHttpRequest. Four of them are in the functions GUIRegion.addImageElement() and UI.showActiveView(), which given their names are related to GUI stuff. We don't care about these. The other one are more interesting: they are in generic functions fetchText(), fetchBinary() (line 2863) and fetchBinaryIncremental(). The first one is of little interest to us, but the binary related functions are very promising.
The function fetchBinary() is called at the end of WebViewer.loadScene() (line 6175), so this makes more and more sense. A quick look at the content of fetchBinary() suggests that its arguments are callbacks, and in particular that its second argument is a function called when the file is fully loaded, so we will focus on this.
In this callback, we can see (line 6184) that the data is passed to scene.load(new Archive(data)). This suggests to look at the class Archive, and at the load() method of the Scene class. The Archive class is defined at line 528, and it looks a bit like a zip decoder. It reads a succession of concatenated files, decompress them if they are compressed, and store them by name in its files attribute.
At this point, it is time we download the mview file and have a look at its raw content. You can get the address of the file vivfox.mview by right clicking on it in the Network Monitor and selecting "Copy > URL". (If your browser does not let you download the file, here's a trick.)
Binary inspection
What can we do with a binary file we know nothing about? We can naively start to read it as if it were a text file. If you don't want to open a 3 Mo file that may actually not contain readable characters in a text editor, you can also simply display its first 1000 characters using the head comand in a bash terminal:
head -c 1000 vivfox.mviewNB: You may have bash even if you are using Windows, for instance if you installed Git, or MSYS, or if you activated the Windows Subsystem for Linux.

head -c 1000 vivfox.mview
Obviously, the mview file is not a text file, so most characters are unreadable. But we can already notice the thumbnail.jpgimage/jpeg at the beginning. Let me introduce another critical tool for binary inspection: xxd. You can pipe the output of head to it, like so:
head -c 1000 vivfox.mview | xxdor run xxd on a whole file, but this can output a huge amount of lines, so it is careful to pipe it to less and then navigate the output using the arrow keys (press q to quit):
xxd vivfox.mview | lessNB: Again, this works on Windows with Git Bash.
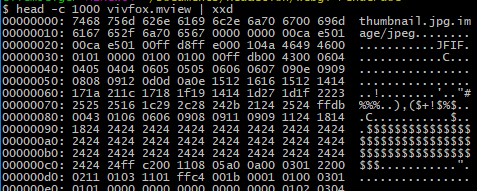
head -c 1000 vivfox.mview | xxd
This prints the same data in two different format. On the right-hand side is the file interpreted as text, or a dot if the character is not recognized. On the 8 middle columns is the very same information, but displayed as hexadecimal numbers. There is exactly 16 bytes of data per line, and the left-hand column shows the position in the file, in bytes, formatted in hexadecimal.
We can thus notice that there is a null character between "thumbnail.jpg" and "image/jpeg". If we look back at our marmoset viewer code, lines 534/535 shows that these two strings are read respectively as the name and type of the first file of the archive. Everything matches! More interesting, we can interpret the bytes following the strings. The next lines of the Archive code read 3 unsigned integers, laconically named c, d and e. The few next lines show that d is the number of bytes to read from the archive, c is a boolean specifying whether the file is compressed, and e is sent to the decompress function. The latter is actually the decompressed size of the file.
This is great, because even if for now we cannot decode the archive, we can already list its content! For a quick test, I like to use Python and its handy struct module. For instance, struct.unpack('I', data) decodes an unsigned int from data. I wrote a very simple loop to list archived files: list_marmoset_archive.py
This is how the beginning of the output looks (full version):
Name               MIME type          Compressed       Size   Raw size
thumbnail.jpg      image/jpeg              False    0x1e5ca    0x1e5ca
sky.dat            image/derp               True   0x127a8e   0x200000
mesh0.dat          model/mset              False    0x43230    0x43230
mesh1.dat          model/mset              False     0xd86c     0xd86c
mat0_c.jpg         image/jpeg              False    0x2c055    0x2c055
mat0_r.jpg         image/jpeg              False     0xbc42     0xbc42
mat0_n.png         image/png               False   0x110666   0x110666
mat0_g.jpg         image/jpeg              False    0x415a8    0x415a8
MatTable.bin       animData/mset           False     0x1200     0x1200
SkinRig0.dat       skinrig/mset            False     0x473e     0x473e
SkinRig1.dat       skinrig/mset            False    0x14116    0x14116
Anim1Objat         keyframes/mset          False       0x4c       0x4c
Anim1Obj1at        keyframes/mset          False       0x4c       0x4c
Anim1Obj2at        keyframes/mset          False     0x3b5c     0x3b5c
[...]
scene.json.sig     application/json        False      0x3a0      0x3a0
scene.json         application/json        False    0x3a20e    0x3a20e
So, there are some file formats that we know already, like jpegs, and they are not compressed (because the content of a jpeg file is already compressed in itself), so we can extract it from the archive with just a kind copy/paste! I made a variant of the previous script that extracts the archive items into individual files: extract_marmoset_archive.py

Textures of the Vivfox model extracted from the mview archive
Most files are under proprietary formats, but at least we got the textures. Now, if we look at the content of Scene.load() (defined at line 3373), we can see that the entry point of an mview archive is the scene manifest scene.json. This must define the list of 3D meshes and link them to their materials and animation data. A JSON file is a perfectly human-readable text-based file, and this one is quite self-explanatory. The items present at the root of the object are metaData, mainCamera, Cameras, lights, sky, meshes, materials, AnimData and shadowFloor. The file seems large, but most of it is about animation, and we'll ignore it for now. Let's focus on meshes.
There are two meshes, Fox_LOD01 and Fox_LOD01_Wings, coming from files mesh0.dat and mesh1.dat respectively. Another interesting piece of information that will help us decode the dat files is the content of indexCount, indexTypeSize, wireCount and vertexCount.
We have a better idea of what the scene.json looks like, so we can head back to the code of Scene.load(). At line 3406, we see that mesh information is handled by the Mesh class (makes sense), that receives the JSON data and the .dat file content. So, let's jump to that, find function Mesh at line 2696 and look there for the calls to readBytes(). There are 3 calls, loading the indexBuffer, the wireBuffer and the vertexBuffer and pushing them directly into the GPU memory with gl.bufferData (the variable a is actually gl, the WebGL API).
Point attributes
The wireBuffer is the equivalent of the indexBuffer used when displaying the wireframe view in the Marmoset Viewer. So what we have here is precisely what we where looking for: the point attributes, in the vertexBuffer, and the topology, in the indexBuffer. There is still one point to clarify, because we don't know yet where in the point attribute buffer are the 3D location of the points.
There are typically two ways of laying out the information within the point attribute buffer. One can (A) write all the positions, then all the texture coordinates, then all the colors, etc. Or one can (B) write all the attributes of the first point, then all the attributes of the second point, etc.
== Attribute Layout A ==
XYZXYZXYZXYZ...XYZ
UVUVUVUV...UV
RGBRGBRGBRGB...RGB

== Attribute Layout B ==
XYZUVRGB
XYZUVRGB
XYZUVRGB
...
XYZUVRGB
In the OpenGL API, this choice is specified through the vertexAttribPointer() function. In Marmoset, it is called for each attribute in MeshRenderable.draw() (line 2749). In particular, we will look at the vPosition attribute, whose layout is defined by:
2767 b.vertexAttribPointer(a.vPosition, 3, b.FLOAT, !1, c, f);The documentation of vertexAttribPointer says that the signature of this function is:
gl.vertexAttribPointer(index, size, type, normalized, stride, offset);The vPosition is thus defined as an array of vectors of 3 floats. We can reasonably assume that these 3 floats are the X, Y and Z coordinates of the points. The layout information is contained in the stride and offset arguments. This is typical buffer manipulation: the stride says how many bytes there are between two vPosition attributes, and the offset gives the offset of the first vPosition within the buffer.
In our previous example, the stride and offset of the attributes are:
== Attribute Layout A ==
XYZ: stride = 3 floats, offset = 0
UV:  stride = 2 floats, offset = vertexCount * 3 floats
RGB: stride = 3 floats, offset = vertexCount * 5 floats

== Attribute Layout B ==
XYZ: stride = 8 floats, offset = 0
UV:  stride = 8 floats, offset = 3 floats
RGB: stride = 8 floats, offset = 5 floats
The offset is 0 for vPosition, 12 for vTexCoord. The offset does not depend the number of elements, and the stride is the same for each attribute, so we are in a layout of type B. The stride of the attributes is defined in Mesh. It defaults to 32, and can be more if vertexColor or secondaryTexCoord are provided, but it is not our case.
We are now ready to load and decode the buffers
# Values from JSON file
indexCount = 7368
indexTypeSize = 2
wireCount = 14736
vertexCount = 7212
stride = 32
with open("vivfox/mesh0.dat", 'rb') as f:
    indexBuffer = f.read(indexCount * indexTypeSize)
    f.seek(wireCount * indexTypeSize, 1)  # skip wire data
    vertexBuffer = f.read(vertexCount * stride)
To extract data from the buffer, we use again the struct module. For instance to get the coordinates of the 43th point:
import struct
vertexIndex = 42
offset = 0  # or 12 for texture coordinates
x, y, z = struct.unpack_from("fff", vertexBuffer, offset + stride * vertexIndex)
Yay, the point has coordinates (-12.329, 49.946, 51.367)! Well, we have no way to check this... The best way to check is to export all points in an OBJ file and check that it looks like a fox. I chose OBJ file because it is a damn simple text-based format that any modern 3D software can read.
with open("fox.obj", 'w') as obj:
    for i in range(vertexCount):
        x, y, z = struct.unpack_from("fff", vertexBuffer, offset + stride * i)
        obj.write("v {} {} {}\n".format(x, y, z))
Point positions extracted from the vivfox.mview file
Once loaded in Blender, we have the right points! I instantiated spheres on points for better visualization.
Topology
It is now time to add the faces or, as we called it before, the topology. This information is contained in the index buffer, but it is not expressed as a list of triangles that we could directly dump into an OBJ file as we did with vertices. For attributes, the data layout was specified with the vertexAttribPointer() function. For the topology, we need to track the draw call that instructs the GPU to render the mesh. There are a couple of variants of the draw call functions in the OpenGL API, and they all start with "draw".
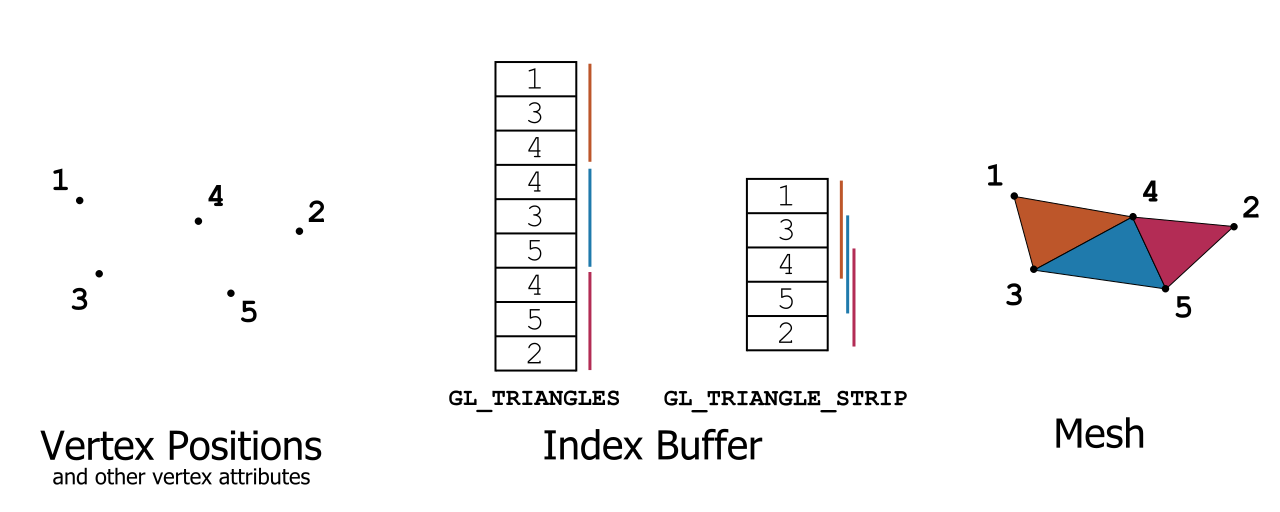
OpenGL index primitive types
This graph describes the two most used triangle topologies available in OpenGL (and other graphics APIs). The same output mesh (on the right-hand side) can be obtained from the same vertex attributes (on the left-hand side) using two different index buffers with two different topology modes. The mode GL_TRIANGLES requires to list all the vertices of each triangle. The mode GL_TRIANGLE_STRIP is much more compact, as it reuses vertex indices from one triangle to the next one, but it requires a special sorting of the polygons that is not always possible.
We find a draw call in MeshRenderable.draw() (once again, this code makes a lot of sense): drawElements(). The most important argument is the first one, the primitive type. OpenGL has a set of primitives corresponding to different interpretations of the succession of indices contained in the index buffer.
The primitive type used by the Marmoset Viewer is GL_TRIANGLE (line 2779). So... I was wrong, the index buffer actually is a list of triangles. But it was worth checking, because other viewers like Sketchfab and Google Maps use more complex layouts.
Finally, before exporting indices, we must take care of the way each individual index is represented in the buffer. An index is "just" a number, an integer number. But there are many ways to store an integer: on 8 bits, 16 bits, 32 bits, 64 bits, etc. And the integer can be signed (have potentially a negative value) or unsigned (always positive). For vertex indices, it has no reason to be signed, so we will assume that they are unsigned integers. But what about the bit depth? The third argument of drawElements() will tell us. It is set as the mesh's indexType attributes, which is set on line 2711 to GL_UNSIGNED_SHORT, because our indexTypeSize is set to 2. This means that these integers are represented on two bytes, which is unpacked with the character H in a struct.unpack format (instead of I for a 32 bit unsigned int).
with open("fox.obj", 'w') as obj:
    # [...] write points
    for i in range(indexCount / 3):
        v0, v1, v2 = struct.unpack_from("HHH", indexBuffer, 3 * indexTypeSize * i)
        obj.write("f {} {} {}\n".format(v0 + 1, v1 + 1, v2 + 1))  # OBJ indices start at 1
And tadaam:
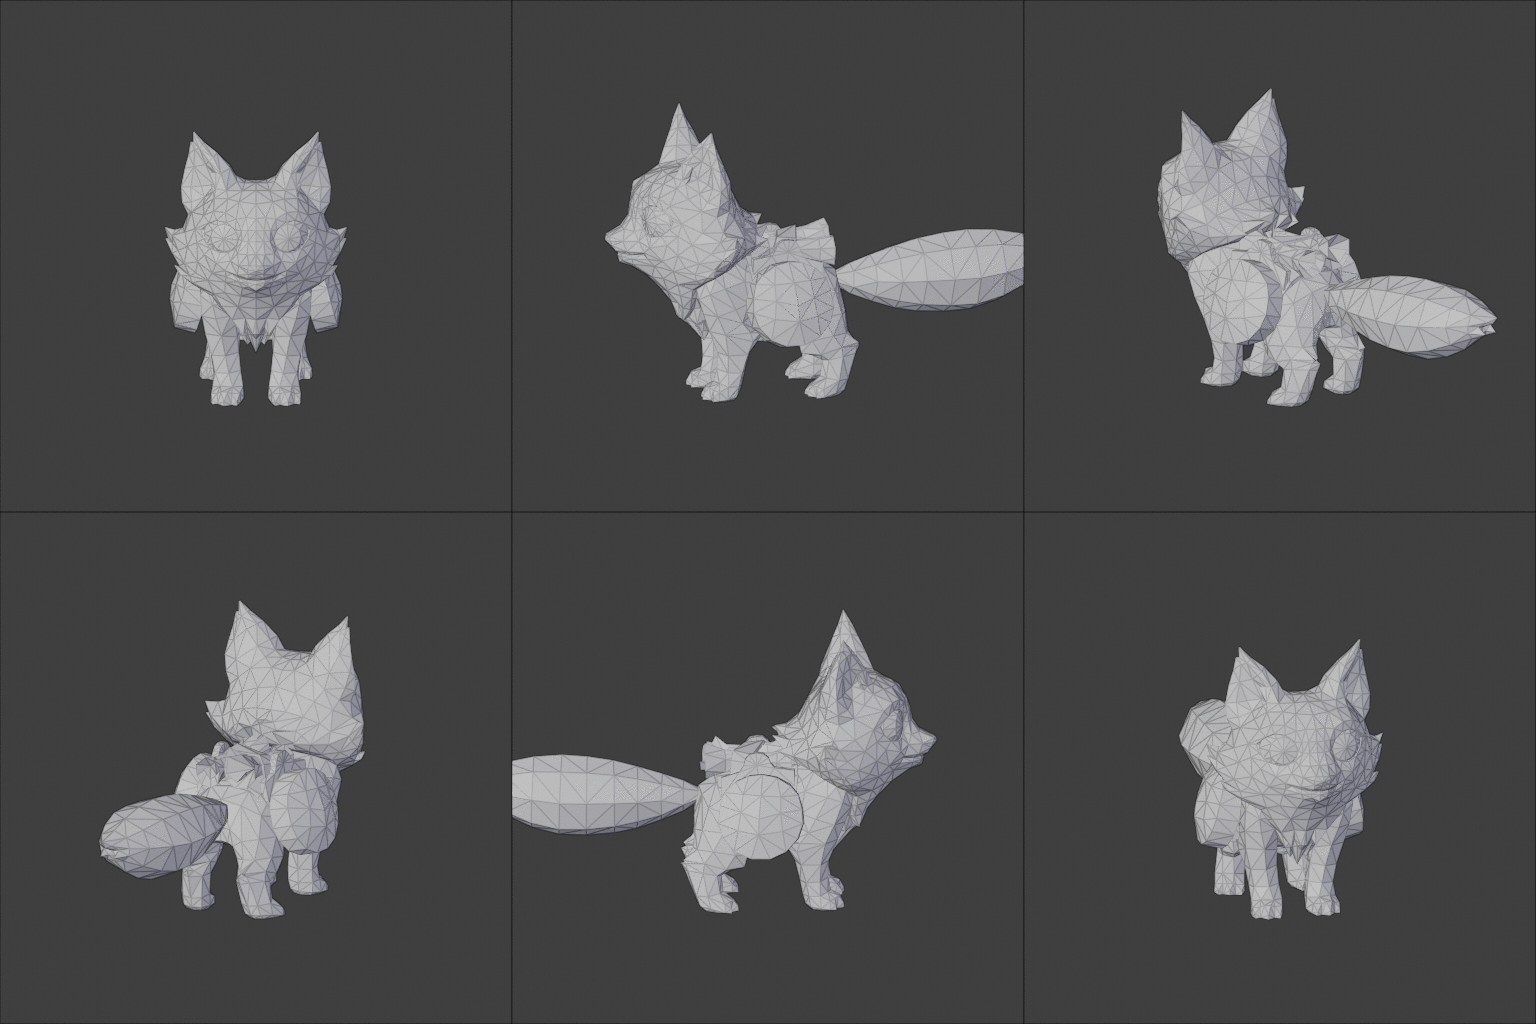
Fox topology
I will leave as an exercise to the reader the texture coordinate extraction and shading:
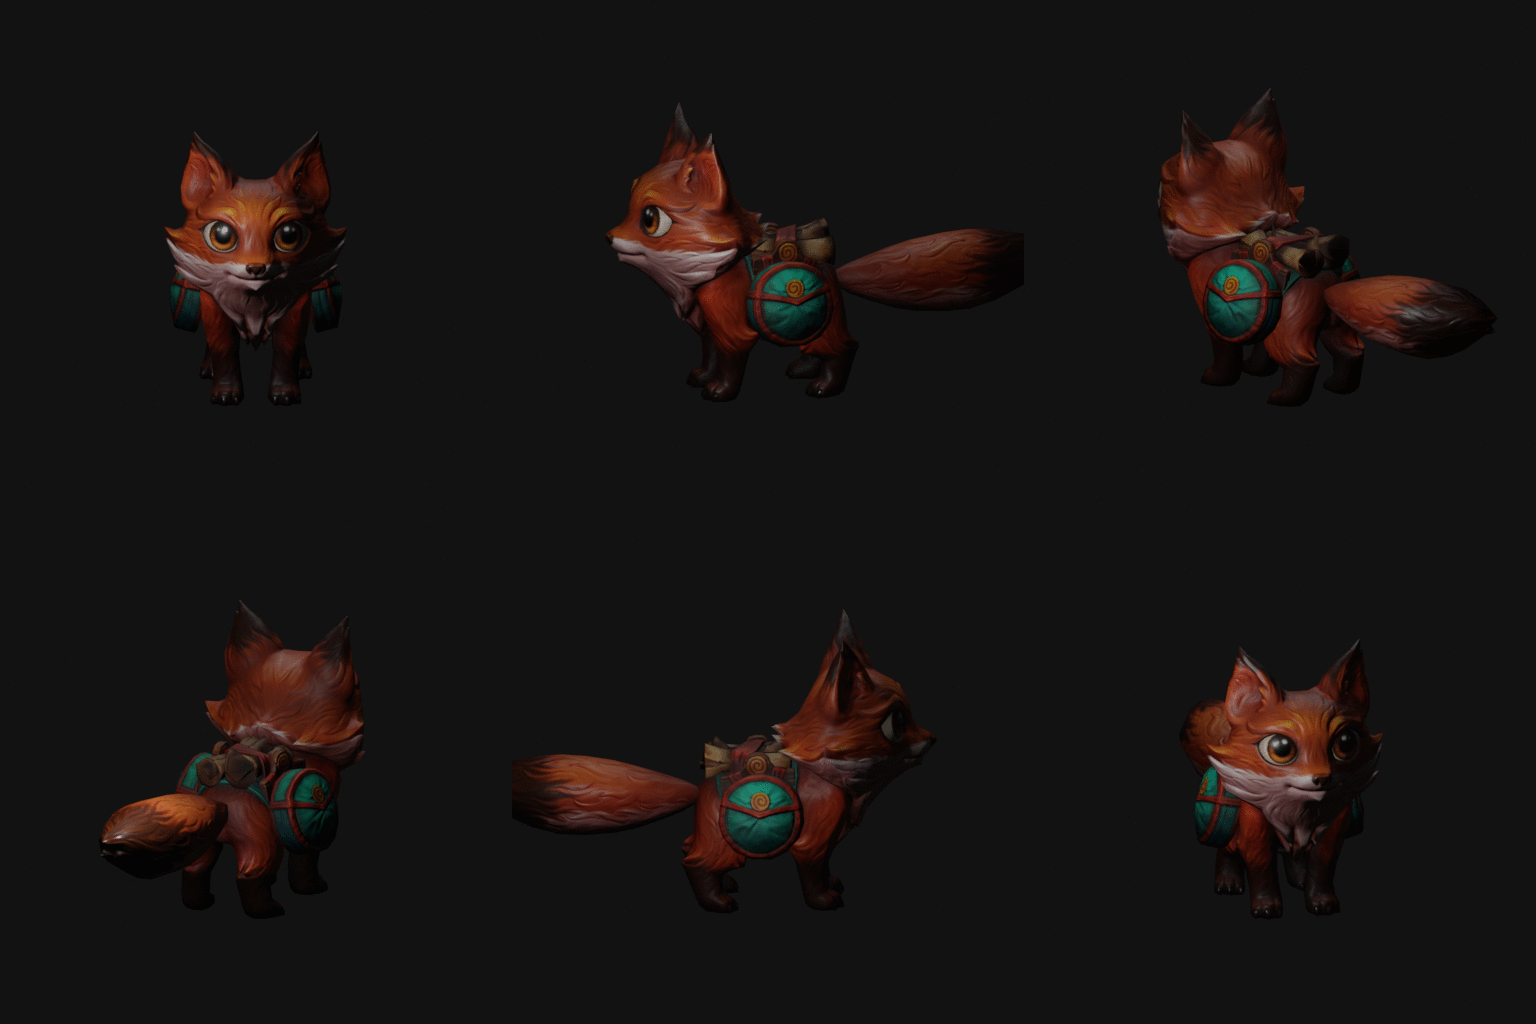
Fox topology
Conclusion on Marmoset Viewer
Things could have got worst. We did not have to look at the Archive.decompress() function. The code was easy to read, the data all in one place. We did not have bad surprises with the buffers decoding. So getting data out of the Marmoset Viewer was a good introductory exercise, but things are going to get wilder with Sketchfab and even worst with Google Maps.
An interlude about ethics
After this exercise, you may be tempted to write and distribute a little script that basically convert a mview file into an OBJ, or any other format. I must argue against that. I am not concerned about the Marmoset company, but about the community of creators who rely on these great platforms to showcase their work.
It is possible to get their work, this post shows it, and it would be absurd to try to hide it, but it is nevertheless not a reason to make it accessible to random script-kiddies. The rise of platforms like Sketchfab is a good thing, and although I believe in open content, I also know that 3D content creation is not the most financially rewarding occupation.
So please don't do that, by respect to the creator's work. And anyway, you would not be allowed to use it for anything, legally speaking.
Sketchfab
We are carried away by our success with the Marmoset Viewer and now want to get some 3D models from Sketchfab. Let's try for instance with this construction vehicle (that I bought beforehand).
We can start by applying the same recipe as with the Marmoset Viewer. Open up the network inspector, and load the page. The first thing we can notice is that the viewer implements a progressive loading:
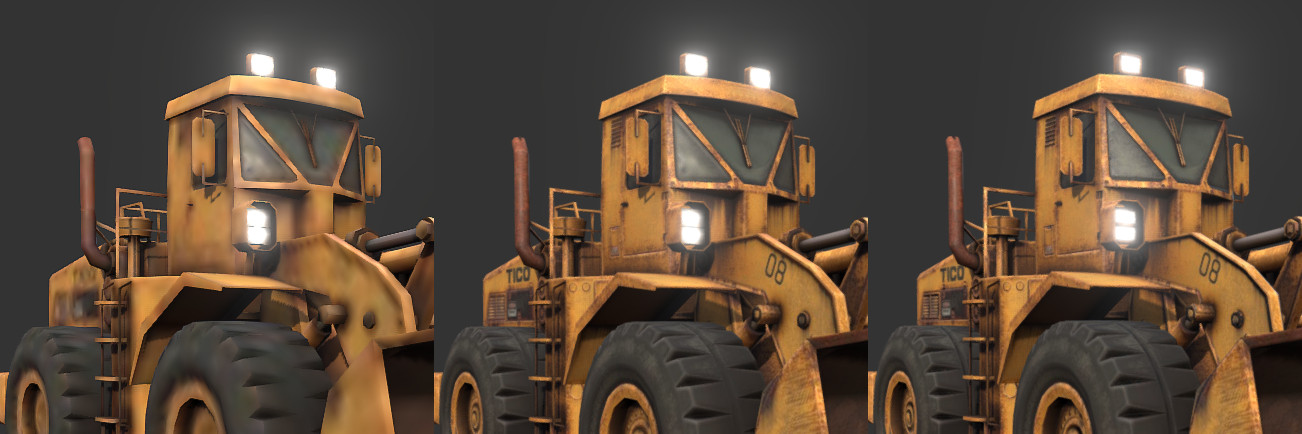
Sketchfab progressive loading steps
So we can already be sure that the data does not come in a nice single query like a mview archive. On another hand, we also see that each texture is loaded as a regular file that can be easily saved.

Texture query in network monitor
To spot the data file, we sort the queries by weight:

Heavier queries of SketchFab
The heaviest query is a 2 Mo .bin.gz file. The bin suggest that it is a binary blob, likely to be 3D data, and the .gz is a good news. It means that the file is compressed with a standard gzip algorithm, which can be uncompressed by 7-Zip, for instance. But... turns out it only contains a specular_cubemap_ue4_256_luv.bin file. This is a cubemap, a lighting texture surrounding the scene, not our geometry.
We will look for other such compressed files, and in particular filter queries by type to keep only those fired by "XHR", the XMLHttpRequest object we already looked at with Marmoset. And surprise, there is a model_file.bin.gz among all the randomly named files.
Another noticeable file is file.osgjs.gz. How interesting! As suggested by the first line of this file of this JSON file, it uses a the open source format of OpenSceneGraph. Well, actually it uses a variant, the OSGJS format, so there is no way to open it with OSGViewer, the official OpenSceneGraph viewer.
What is convenient, is that the OpenSceneGraph format uses terms very close to OpenGL vocabulary, so we might not need to look at the viewer's code! This is cool, because if you were afraid by the 6k lines of Marmoset Viewer, you are not going to love the 60k lines of Sketchfab's one.
Let's for model_file.bin.gz in the osgjs file. It occurs 17 times, so it must actually contain a concatenation of all the buffers of the scene. It is present inside blocks named DrawElementsUInt, DrawElementsUShort, DrawElementsUByte and VertexAttributeList. If you did not give up on the Marmoset section above, you might recognize here references to the glDrawElements() and glVertexAttribPointer() OpenGL functions!
The suffix of the DrawElements sections specifies the bit depth of the indices in the index buffer. Let's consider for instance the first one:
"DrawElementsUInt": {
    "UniqueID": 15,
    "Indices": {
        "UniqueID": 16,
        "Array": {
            "Uint32Array": {
                "File": "model_file.bin.gz",
                "Size": 2791,
                "Offset": 0,
                "Encoding": "varint"
            }
        },
        "ItemSize": 1,
        "Type": "ELEMENT_ARRAY_BUFFER"
    },
    "Mode": "TRIANGLE_STRIP"
}
This means to me "load the first (offset = 0) 2791 32 bit unsigned integers from model_file.bin.gz" and importantly interpret them as a TRIANGLE_STRIP, and not a list of triangles!
To test this, we must find the point attributes used in this call. But there are 6 occurrences of VertexAttributeList. To determine the one to use, it must be in the same Geometry node, so likely the first occurrence after the DrawElementsUInt will work.
Hint: In Sublime Text, look a few lines before DrawElementsUInt for a line containing "osg.Geometry": {. Place the cursor right after the bracket, and press Ctrl+Shift+M. This will select the whole Geometry block, and you'll know where to look for the appropriate VertexAttributeList.
"VertexAttributeList": {
  [...]
  "Vertex": {
    "UniqueID": 11,
    "Array": {
      "Int32Array": {
        "File": "model_file.bin.gz",
        "Size": 3728,
        "Offset": 41776,
        "Encoding": "varint"
      }
    },
    "ItemSize": 3,
    "Type": "ARRAY_BUFFER"
  }
}
Vertex positions are also in model_file.bin.gz, but start at the 41776th byte. There are 3728 items. Each item has 3 component. But what component? Integers, Floats? Encoded on 16 bit, or 32 bit?
Since the word "stride" doesn't appear anywhere in the file and all attributes start at different offsets, we can conclude that Sketchfab viewer (or OSG.JS, should I say) uses the data layout that I called "A" above. In this case, the stride is the size of the item.
Regarding the component type, the mention to Int32Array suggest that they are 32 bit signed integers. We can now dump the points from the uncompressed model_file.bin:
import struct
offset = 41776
vertexCount = 3728
stride = 3 * 4  # 3 components of type 32-bit float
with open("model_file.bin", 'rb') as f:
    f.seek(offset, 0)
    vertexBuffer = f.read(vertexCount * stride)

with open("vehicle.obj", 'w') as obj:
    for i in range(vertexCount):
        x, y, z = struct.unpack_from("fff", vertexBuffer, stride * i)
        obj.write("v {} {} {}\n".format(x, y, z))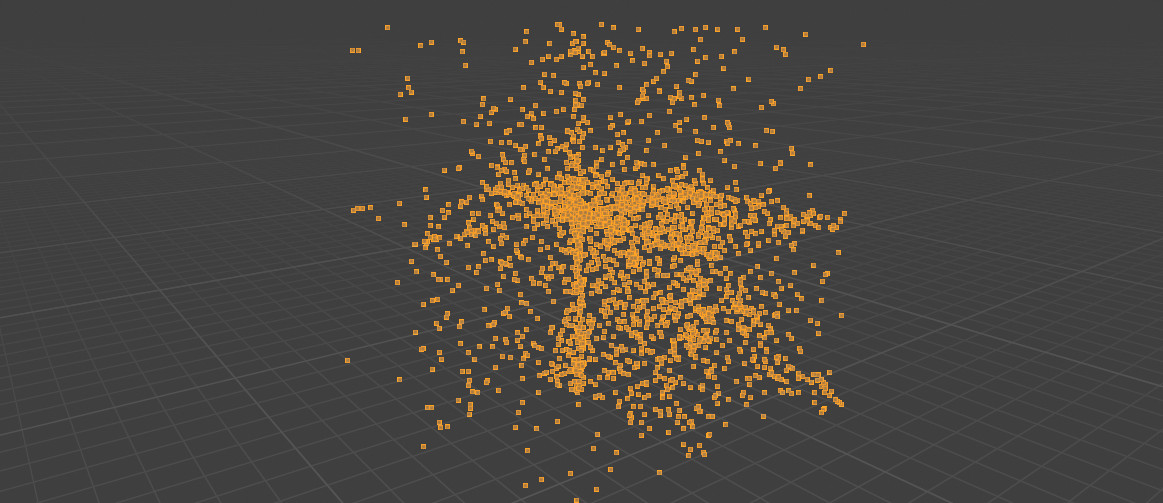
First attempt to decode vehicle vertices positions
Oops... This really doesn't look like a truck. As it turns out, I underestimated the "Encoding": "varint" line. This is an encoding used to represent series of integers in a more compact way than just concatenating them. Well, Marmoset vertex attributes were not compressed; here they are compressed twice! We can find details about varints here. So I made a little varint.py and tried again.
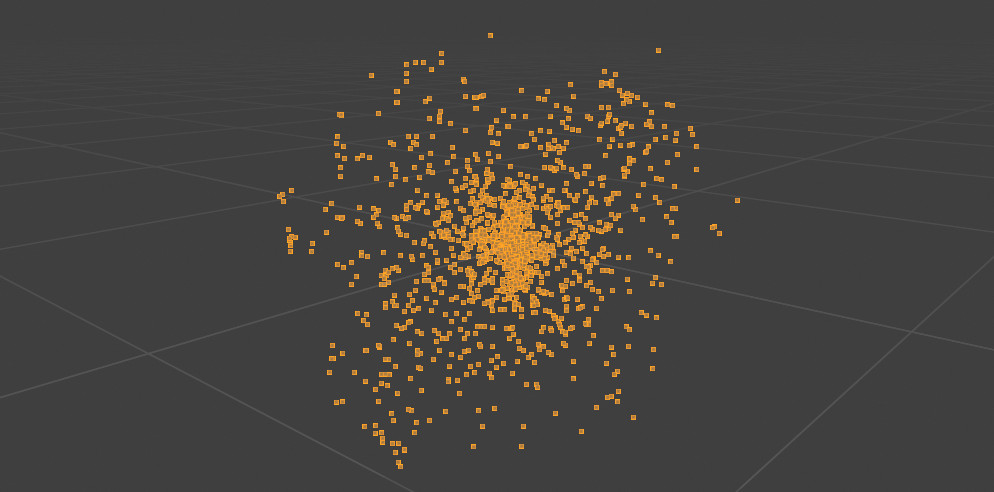
Second attempt to decode vertex positions
Still not working. I performed some basic checks with my varint decoder, and in particular when I decode the TexCoord attribute, the decoding process stops right before the offset 41776 at which the Vertex buffer starts, so this must be right. I did not want to do that at first, but I ended up reading the viewer's source code.
I found the varing decoding function (line 50989) and it matches my implementation. I found bounding box correction, I read the vertex shader. It seems complicated, with vertex position decompression, and stuff that might be intentional obfuscation from Sketchfab, like a RAND_SCALE uniform. Decoding the index buffer seems complicated as well. The index buffer includes a header, and my attempts to get something out of it were unsuccessful.
So, shall we give up? No, I think it is time to step back a bit. We focused on trying to decode the data as it comes from the server, when it first reaches the client's computer. But instead of mimicking the data decoding process performed by the viewer, couldn't we let it do its job and extract the data after this is done?
Intercepting the data between the server and the viewer was convenient, because the network monitor gives us direct access to all the resources. But once in the memory of the JavaScript VM, it is not so easy to to extract it, even with the Memory Inspector provided by the browser's tools. Furthermore, some of the data handling is done in the vertex shader, so on the GPU. This will hence never be accessible from the browser.
RenderDoc
Toy example
This is where RenderDoc comes in. RenderDoc, and its homologue NSight, is a GPU debugger. Think of it as the browser's developer tool, but for monitoring the GPU. They are wonderful tools when you need to debug OpenGL or DirectX applications. RenderDoc records all the calls to the graphic API and their arguments, so that it is able to fully replay it and inspect it step by step.
NB RenderDoc is not intended to be used as a hacking tool, and is not supported for that. It is a GPU debugger, but as a side effect of being a good debugger, it gives us access to the data we need.
Before trying more complicated stuff, it is good practice to start with a simple example. I will use for this an OpenGL 4.5 Hello World that I wrote lately. Its render() function is very minimal:
void render() {
    glClearColor(0.0f, 0.0f, 0.0f, 1.0f);
    glClear(GL_COLOR_BUFFER_BIT | GL_DEPTH_BUFFER_BIT);
    glUseProgram(program);
    glBindVertexArray(vao);
    glDrawArrays(GL_TRIANGLES, 0, 3);
}
We build this, then launch it with RenderDoc. The application will run with an overlay with information about the graphical API in use (OpenGL, here) and the frame number. As it says, press F12 to capture a frame. In the RenderDoc window, the capture appears, and you can double click to open it. You will then see the list of rendering "events" in the Event Browser window.
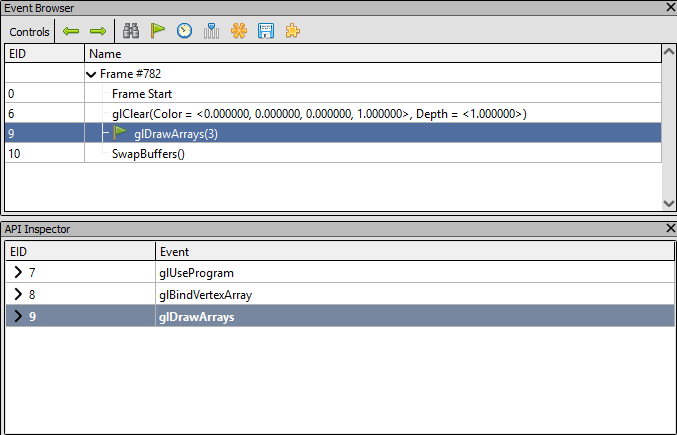
Render Events in RenderDoc
We recognize our calls to glClear() and glDrawArrays(). The buffer swap is done in the main loop, by glfwSwapBuffers(). And what about the glUseProgram() for instance? For some reason, only calls that affect the framebuffer are displayed here, but you can see the other calls when selecting a line in the Event Browser.
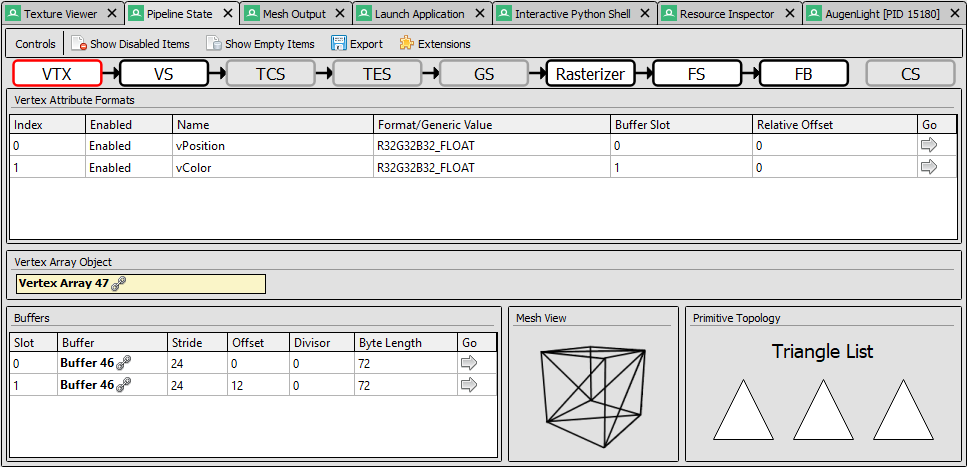
Pipeline State in RenderDoc
The other key element of RenderDoc is the Pipeline State panel. It describes the state of the GPU's rendering pipeline during the draw call. The first step, VTX, describe the draw call input, so the vertex attributes, and the topology. Exactly what we were looking for! In this example, there are two attributes, vPosition and vColor. The topology is "Triangle List", which is consistent with the use of GL_TRIANGLES in our code. There is no index buffer, because glDrawArrays() is not an indexed draw call. It assumes that the index buffer is [0, 1, 2, ..., n] where n is 3 here.
The right arrow in the vertex attributes array leads us to the Mesh Output panel, and there is again good news here. This panel shows all the values of the input vertex attributes, but also the output of the vertex shader! And we can easily save them to disc.
Debugging WebGL with RenderDoc
We now know how RenderDoc works, and we have an example to experiment with set up. But let's head back to our original problem. We need to capture frames in the browser. Logically, we try to launch the browser from RenderDoc, as we did with our little test program.

Launch browser in RenderDoc
Unfortunately, this does not work, neither will it work with other browsers. I am not sure exactly why, but the use of process forks and some other advanced mechanism must loose RenderDoc. So we can adopt another strategy: starting the browser first, then attaching RenderDoc to its process using the "File > Inject into process" menu.
Since RenderDoc needs to get attached before any graphical operation is initiated, we will use the --gpu-startup-dialog argument available in Chrome. It opens a popup telling on which GPU chrome is running, and does so before initializing the graphics.

Chrome GPU Popup
So we can launch chrome, attach RenderDoc, and only then press the Ok button on the popup. Two other options were important for my RenderDoc to get attach, but this might depend on your setup: --disable-gpu-sandbox and --use-angle=gl. For convenience, I created a shortcut with the target:
"C:\Program Files\Google\Chrome\Application\chrome.exe" --disable-gpu-sandbox --gpu-startup-dialog --use-angle=glIt is important that after the injection, and after you validated the popup, the status box in RenderDoc shows something different than None in front of "API:". For instance, it can be "OpenGLES (Active"):
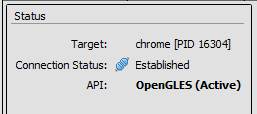
Injection status
Now, open the Sketchfab page of your choice, and take a capture using F12. To ensure that the capture will include the part about the 2D model, turn the 3D view at the same time. This way, the GPU will have to recompute it.

Recording frames on Sketchfab
This time, the render events list is much longer than in our example. This may vary, but I have 728 calls to the graphics API recorded, organized in many passes. If you have significantly less events, or just a single render pass, this might be that you captured a compositing pass, drawing the UI of the browser instead of the viewer events.
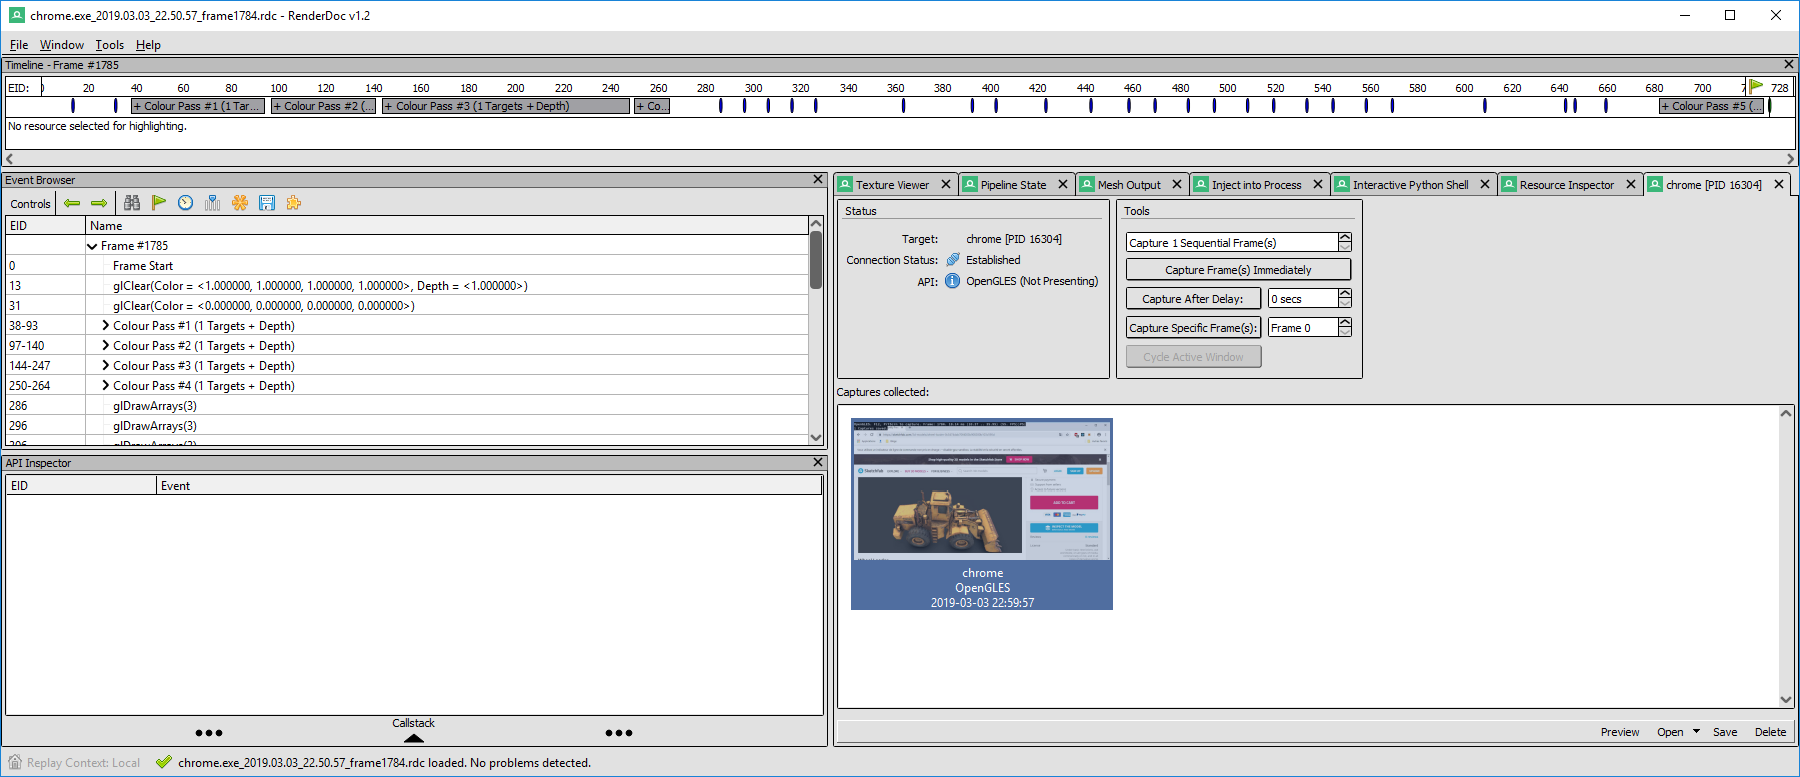
The captured frame contains a lot of events
There are many draw calls. Some render the same list of attributes, with the same index buffer. Typically, the first pass, or the two first passes, are rendered from the position of the light, and used to compute the shadow maps. Track the draw calls that use all the textures, using the Texture Viewer panel. In my case, it is in pass #3.

The third render pass draws the geometry in 5 calls
My pass #3 has 5 draw calls. The last one has only 4 points, it is the ground plane. The previous one are the two parts of the mesh, with for each one a triangle strip followed by a triangle list to fill the holes. This matches the description found in the JSON file. From this, you can export the vertex data as CSV and write a little script that reads it, in particular the output of the vertex shader called gl_Position, and save it as an OBJ. Note that the vertices in the CSV are sorted, and potentially repeated, according to the index buffer, so you don't have to worry about this.
I'll let you work on the CSV to OBJ script by yourself, but don't forget to apply the right topology. When it is a triangle list, it is easy, but the GL_TRIANGLE_STRIP topology is used by some of the draw calls (not all, check in the Pipeline state panel). This is a very basic algorithmic exercise: given a list of indices [1, 2, 3, 4, 5, 6, 7, ...], return the list of triangles [(1, 2, 3), (3, 2, 4), (3, 4, 5), ...]. Note that the second triplet is (3, 2, 4) and not (2, 3, 4) in order to preserve the face normal. Every odd triplet must be reversed like this.
If you got this right, you should end up with a very nice model, for instance in Blender:

Final model extracted into Blender
Once again, I don't want to make it easy for anybody to download models from Sketchfab, so I won't provide any full-featured script. I will have less concern regarding Google Maps.
How do I protect my 3D models?
If you are publishing content on Sketchfab, you might be a bit worried. But don't worry too much. It is still a lot of work, and skilled work, to steal your models, so in many cases if you sell your model at a reasonable price it will remain more expensive for a company to steal than to buy. And it gets even more complicated when your model is animated, or uses advanced rendering effects.
If you really freak out, add watermarks directly on the textures of the model. Of course it does not protect the geometry, but what is a geometry without its texture? Especially if it is a low poly on which a high definition model has been baked.
If you sell point clouds from 3D scans, don't include all the points in the WebGL preview, or maybe show the true density only on one part of it. If you sell triangles, cut you mesh into many little meshes, it'll get longer to retrieve it. I don't know, get inventive, or trust people. Anyway, it remains illegal to use your stolen models, which adds another cost to the thief.
Google Maps
Ok, so cool, we are true hackers now, let's head to Google Maps!
Which data bottleneck should we focus on? The main difference between Google Maps and the previous examples is that Google Maps never loads the full 3D model of the whole world, obviously. Instead, it uses a powerful Level of Detail (LoD) mechanism and streams the geometry at a resolution depending on the distance to the view point. There may be more than 10 levels of details covering a well scanned area.
Ideally, we would prefer to find how to decode the queries, and even how to emit them. This way, we would be able to query the higher resolution models for a whole region. This never happens in practice, because of the LoD mechanism, so intercepting the data when it reaches the GPU does not allow for this. At least, not from a single capture.
When one moves around in the Google Map's 3D view, data comes in a lot of little queries encoded using protocol buffer and raw octet streams, which are very dense and so hard to decode without the format information. It does not contain meta information like the data keys of a JSON file. So it is capital to hand on the source that decodes this data.
But if you got lost while analyzing Sketchfab viewer's code, you'll never come back from Google's code exploration. Google uses a lot of optimizations that make their code totally obscure.
Long story short, I have not been able to decode Google Maps packets, but for those of you who would feel giving it a shot, here are some entry points to the code. Looking for << 7 is a good way to spot the varint decoder, and by that the protocol buffer decoder. We can spot a linear algebra library with lines such as a.length == b.length && a[0] == b[0] && a[1] == b[1] && a[2] == b[2] that is an equality test between two vectors. XMLHttpRequest is wrapped in a function, so a little harder to track. Looking for typed arrays like Uint8Array gives more angles.
RenderDoc for the win
No reason to give up, we've got our RenderDoc hammer and all this 3D in Google Maps story looks like a nail. Same process than for Sketchfab: start Chrome with the --gpu-startup-dialog flag, inject RenderDoc into the process, browse to your favorite location in Google Maps, and capture a frame. Again, make sure you move in the viewport while capturing the frame.
For those of you who want to play with us but could not get RenderDoc injected into Chrome, I let you download a capture of a touristic spot you might know. This can be openned and explored with RenderDoc even if it has been captured on another computer. For the record, I used RenderDoc v1.2.
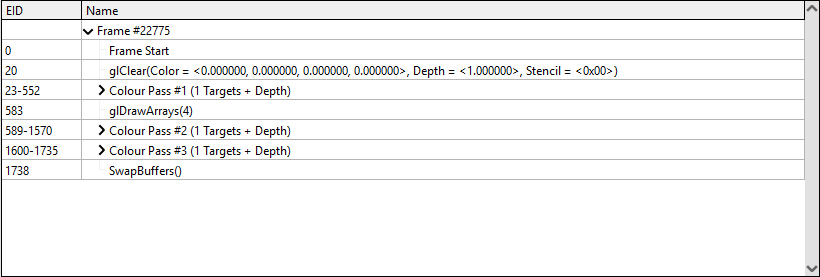
Events captured from a frame of Google Maps
So, here we are, all together with a frame captured from Google Maps. There is no less than 1738 calls to the graphics API in my example! If you have only one color pass, it means that you were not moving while capturing the frame.
In order to figure out what the draw calls do, open on the right-hand side the Texture Viewer panel. If it is not already the case, select the FBO (FrameBuffer Object) texture in the Outputs subtab. This shows the framebuffer (the output) as it was after the selected call. Then browser the calls in the Event Browser, you will see the image progressively building:

Breakdown of a Google Maps frame
The pass #1 draws the map with the streets and their names, that will be overlayed on top of the 3D. The pass #2 draws all the 3D, as well as the little shops and restaurants indicators. Then the pass #3 composites the UI elements on top of it (and turns it upside down, dunno why). That last pass is the responsibility of the browser, it is not provoked by Google Maps' code.
Now, we can just save the vertex attributes, and voilà! But, hey, there are 120 draw calls in pass #2... Actually "only" 57 of them are about the 3D, but it is still a lot of work, plus they all use a different texture (that we can save from the Texture Viewer). And it does not stop here: many chunks of the map will be in lower level of detail, so to correctly capture an area, we might need several captures.
RenderDoc automation API
Still not giving up! RenderDoc can totally be automated thanks to its Python API. It used to be a little tricky to use, but since the version 1.0 it is really complete.
There are two APIs: qrenderdoc and renderdoc. The former starts with a 'q' for Qt because it gives acces to the graphical UI elements of RenderDoc. It can be a way to mimic the click on the save button. But the second API is more interesting: it gives access to the captures at a lower level, more robust to changes in the UI.
You don't need to start RenderDoc to use the renderdoc Python module. This is great, because it enables us to call it directly from a Blender plugin, for instance. But for now we'll work from the RenderDoc's Interactive Python Shell panel. There is just a little boilerplate: manipulating the low level API may conflict with the UI, we must wrap all our instructions in a function and call it with BlockInvoke:
# Print a list of all drawcalls
def main(controller):
    drawcalls = controller.GetDrawcalls()
    for c in drawcalls:
        print(c.name)

pyrenderdoc.Replay().BlockInvoke(main)
The pyrenderdoc variable is set by the interactive shell to the current CaptureContext. From this, we get the ReplayManager because browsing the events is actually replaying the capture.
To complete the code from this I relied a lot on the detailed examples provided by RenderDoc.
Maps Models Importer
I won't go into the details of development, but on the contrary to the previous examples, I have no concern about publishing an easy-to use tool. Not that I am not aware of all the work it represented to gather these scans, but I don't fear for Google's health. Not until they start paying their due taxes in my country at least.
So I released MapsModelsImporter, a proof-of-concept add-on for Blender relying on RenderDoc's dynamic library.
To use it, record a capture as we did above using RenderDoc, save it as an rdc file, then in Blender go to File > Import > Google Maps Capture.

Sacré-coeur imported in Blender
Comparison with photogrammetry
Let's be a bit scientific and confront our work with the baseline that was, if you remember, photogrammetry from screenshots. I found a model on Sketchfab that was obviously obtained using this method: San Maria del Fiore in Florence, Italy.

San Maria del Fiore found on Sketchfab
The main hint is that the lighting is exactly the same than in Google Maps, and according to the details provided by the Sketchfab viewer it is baked into the albedo map. Another hint is that the model has a terrible topology, with many very little polygons. Here is the same place in Google Maps:

San Maria del Fiore in Google Maps
So, to compare the results, I imported the model using Maps Models Importer.

San Maria del Fiore imported from Google Maps
Google Maps' original model has of course much less polygons, but also the texture is better because it has not been rendered and then rescanned. Anyway, the mesh is hard to use as-is if you need to edit it.
Analysis of Google Maps rendering
This tool is a great opportunity to analyze how Google Maps renderer works. It is a nice piece of work, especially for its level of detail mechanism.

A mesh exported from a snigle draw call, from further and further away
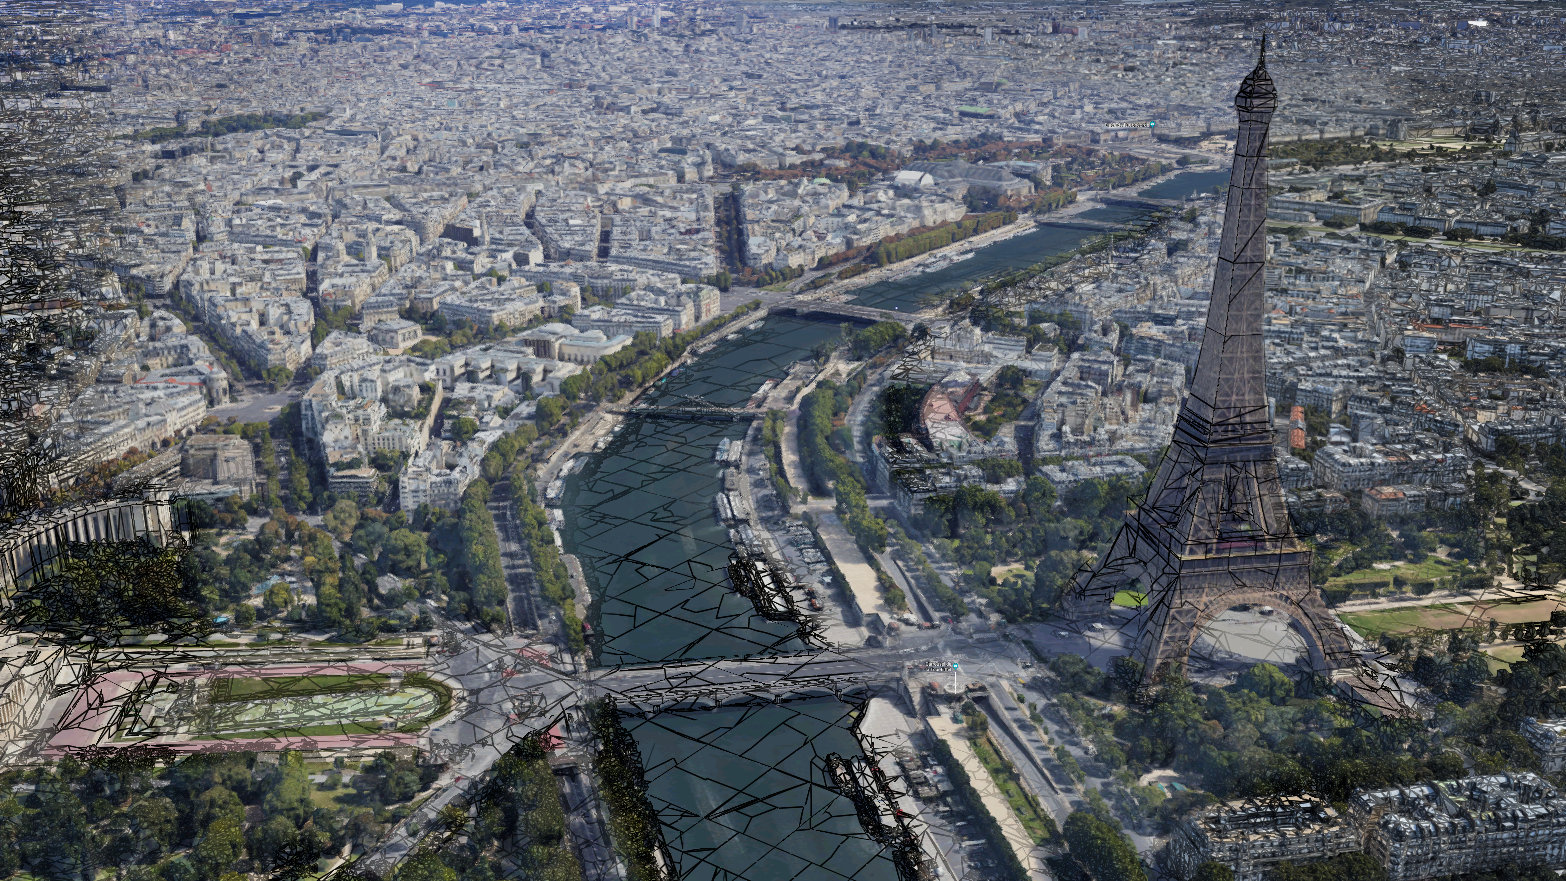
The gif above shows the mesh imported from a single capture taken at roughly 400 m of the ground in Paris. It is the one used for the cover image. There are so many levels of details that to show all of them I had to place the camera at more than 4000 km of the ground! The mesh even shows the curvature of the earth:

The exported mesh covers an area so huge that one can notice the curvature of the Earth
So when rendering a frame in Paris, Google loads data around Vienna or Copenhagen! In cases the Himalaya was there, maybe... Anyway, it is impressive to see so many levels of detail loaded in streaming and seamlessly. This example is a bit extreme, it may be because I simulated a 4K screen to capture more meshes in a single 270Mo frame, but still...
What we have learned
So, to conclude this article, let's summarize the key points that we have seen today.
First of all, as with any media, one can download 3D assets from WebGL viewers. But after all, one can also download videos from YouTube or musics from Spotify. It does not mean that it is allowed to do anything with it.
But what I wanted to show here is less what somebody can do, but what inspecting code and data can be like. Websites are an interesting medium to explore this because we have access to the source code, although sometimes obfuscated, and the inspector tools shows clearly the system calls like xhr queries.
I believe that this exercise is great to improve one's skills in computer sciences. It was a way to see raw memory manipulation, buffer, stride, offset, but also to get some glimpse about the graphical APIs, the vertex attributes, the topology. And, maybe more importantly, we had to read code.
Code reading is one of the most efficients things to do to learn programming. When you read, you understand how to write, and why some rules matter. It is also a very demanding task, requiring to think about a reading strategy. Hacking is mainly about reading: reading code, reading specification, reading binary blobs. Non linear reading. It's like an orientation game/escape game. You explore corridors, and subcorridors, abandon some of them, take some notes, follow blindly a variable like you'd do with a wall.
There is no comment in the version of marmoset.js that we have, but it is not a big deal, because it is well written so we had no difficulties to browse it. On the other hand, going through the pain of reading an obscure code will learn one the hard way to write better code.
We also had to think wider than just programming by asking us what data is available when, where the bottlenecks are, etc. Should we intercept data on transit, learn to decode raw format, or dive a bit further and extract it from memory? Does the object's API allow for all data access, or should we inspect memory dumps?
Another conclusion point is that culture is important. If we did not know what a cubemap is, we could have tried to extract 3D positions from the heavy cubemap image loaded by the sketchfab viewer. One needs to know a bit about the rendering pipeline to track down the geometry data. Recognizing common patterns, whether it is at the code level, in the data, or in metadata such as file names can really help understanding a problem.
Although our example here has a little flavor of hacking, all of this is still relevant in many contexts. Code dies everywhere around us, when maintainers retire or leave to other horizons, and only reading it can save the code. It is sadly often easier to write over than to read.
Take Home Message: Read Code!